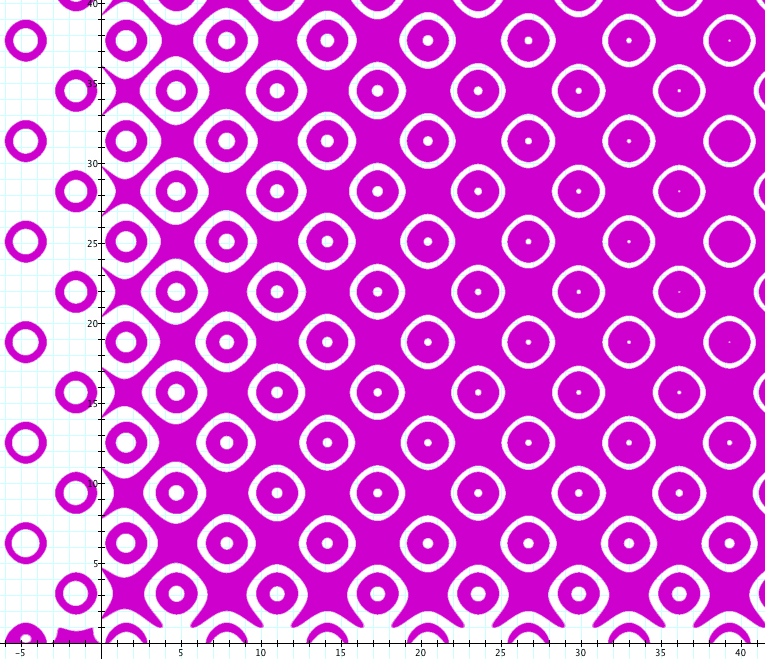
Density plot: z = sin(x)+cos(3x+y)
-
One problem with Grapher is that it's a bit unstable. Changing window dimensions will force a recalculation, and you end can end up with a completely different picture, unable to return to the original.
Such was the case with this relation, but I ended up with a couple of nice plots, anyway.